Helping the machines to understand what the data means, so that they can help us search and cross the data published by our governments.
Initially published on Medium on September 14th, 2014. I’ve replaced some links with more accessible sources (i.e. not hardcore standard specifications) and I’ve also rephrased the last sections to make them more accessible.
Summary (tl;dr;): Publishing open government data dissipates the mist around the business of the State and its tentacles, and enriches the dialogue between the administration and the citizens. However, today, this data is usually not described with machine-readable semantics, which makes it hard to perform large scale search and create value by crossing datasets together.
The Semantic Web technologies come to the rescue: they enable the creation of worldwide identifiers for concepts (the URIs), definitions with machine-readable semantics and data storage and querying as a graph. The result is a standard and semantics-driven open data platform.
Open government data 101
Summary: Publishing open government data dissipates the mist around the administration and enables a healthy dialogue between the giant state octopus and the small fishes. This is called transparency.
Leaders | gap | citizens
This article is written with the digital ink of my passion for open data. It has grown exponentially since the moment I was convinced that it was a fantastic tool to bridge the gap between citizens and their leaders. I think the growing lack of trust comes from the feeling that, although most of our leaders have been directly or indirectly nominated with our votes, many decisions are taken behind our back. And if they are taken behind our back, it must be because they do things they don’t want us to know, right?
This lack of trust led 1) citizens to progressively take distance from the politic life, 2) and the politics to assume the great majority of the electors doesn’t care much about what’s going on at the different decision levels of the State (local, regional, national). You end up with a dialogue that is greatly flawed due to the lack of information shared by all parties, and tensions rise.
Increasing the quantity and the quality of the information describing what is happening in the country and in the administration is the foundation of a healthy dialogue. The United States, the United Kingdom and France are among the countries that lead the pack.
The example of the money allocated to French MPs for local subsidies
To illustrate the problem and its solution, let’s use fresh events that take place in France. On September 20th 2014, the French Ministry of Budget published the distribution of the budget allocated to MPs (en) to subsidize municipalities and associations in their district for 2013. Until then, only the global amount and the amount per region was published. Now, not only do we know how much each MP granted, but we also know the names of the municipalities and associations who benefited from the grants.
The press and associations of citizens analysed (here (en) or here (en)) this information and potential conflicts of interest were highlighted. I assume the MPs will be more careful as the citizens can now watch where the public money goes. On the other hand, wise subsidies are likely to boost the popularity of the MPs who grant them. Or this grant system might simply be deleted as it can be considered as a violation of the separation of powers, as the PMs (legislature) technically replace the municipality, the department and the region (executive) when they fund local associations.
In any case, the publication of the dataset is the foundation of an healthy dialogue, based on shared indisputable facts.
Open government data is like publishing the details of the subsidies granted by the MPs, but at the scale of a country, region or city: making the elected representatives accountable for their actions and giving the citizens the information to base their judgement, and potentially their vote, on facts.
The value of the data
Summary: The administrations are sometimes reluctant to spend resources in open data publications as the return on investment is not obvious. In spite of the lack of maturity of the commercial usage of open data, the transparency, thus the public debate, have quickly benefited from these publications. I think the core value of the data is created when it’s manipulated in a way that unveils new insights that support decisions. And the more you cross datasets, the better the chances to do unprecedented findings.
With the boom of open data, discussions arose around the following question: what is the value of open data? This question is relevant at a time when ministries and other administrations are asked to publish quality data for free. Transparency is noble, but it doesn’t pay the salary of a data specialist who will ensure the published data is consistent and free of confidential or personal information.
Time will tell, but I believe that when manipulating open data, value is created when the analysis unveils brand new insights that lead to better decisions. Although the analysis of a single dataset can be valuable, the most valuable data analyses and visualizations are those that cross various datasets together. This is because, by nature, a dataset has a limited scope.
The scope is the number and the depth of the facets under which a certain thing is described. For instance, we could describe an MP using the following facets:
- personal: age, gender, relatives, contact details
- activity: votes to the proposed laws, questions to the Ministers, participation to the debates, study groups, subsidies
- political: activity in their political party, previous memberships
- career: elections, appointments
- financial: expenses and revenue related to their position
- media: appearances in the media (press, TV, Web, books, documentaries, etc.)
- legal: involvement in legal cases
- etc…
Let’s go back to the grants granted by the French MPs in 2013. The data was published by the Ministry of Budget as a Web site with basic filter functions (en). The dataset is a table that lists all the grants. For each grant, the following information is included:
- Name of the municipality or association who received the grant
- Name of the MP
- Political party of the MP
- District of the MP (thus the district where the beneficiary is located)
- Reference of the budget program
- Amount of the grant
- Object of the grant (e.g. purchasing X, fixing Y, running costs, etc.)
Publishing a dataset with a specific scope is good, because it makes its purpose easy to identify. However, crossing this data with more data about the MP enables a deeper analysis and above all, has great chances to unveil insights that had never been discovered in the past as the two datasets were managed and used in isolation.
The association Regards citoyens (in English “Citizen looks”) published an enriched version (en) of the dataset published by the Ministry of Budget. Besides the facets that were included in the original dataset, they have added the following ones:
- Gender
- Link to the official Web page of the MP (example, en)
- Link to the Web page that aggregates information about the MP on the Web site of Regards citoyens (example, en)
- Link to the data previously collected by the association about the MP in XML format (example)
By including links to the content they have previously collected, the association greatly enlarges the scope of the original dataset. Here is a sample:
- membership in study groups
- occupation
- contact details
This aggregation adds value because:
it enables the crossing of the data about grants with the data about the commissions the MP belongs to, extending the information about the commitments of the MP
it bridges the gap between different pieces of information that compose the whole public information about MPs, saving time for future research.
The added value is not easy to measure in financial terms, especially so soon after the publication of the data. Moreover, the consumption of data published by the government is not common practice yet.
Published by humans for humans
Summary: If data crossing favours the discovery of new insights, it should be made easier: nowadays, locating government datasets that can be crossed is cumbersome, in spite of the deployment of faceted search engines. The problem is that the current metadata about the datasets is too superficial.
The initiative of enriching the data published by the government is noble, but this aggregation of datasets could be made easier.
Technically, enriching a dataset means adding extra columns of data from dataset 1 that describe a subject present in dataset 2. In database terms, this subject, it’s a foreign key, an identifier that is available in two different datasets and that refers to the same thing.
When a new dataset is published on most open data portals, some metadata is also published, such as the date of publication, the administration that publishes the data, or its domain (health, elections, etc.). This metadata enables the creation of faceted search engines (data.gouv.fr, data.gouv.uk) that help performing accurate search among the numerous datasets.
However, no metadata indicates what columns the dataset contains.
Back to the French MPs: a possible way to enrich the original dataset would be to add information about the associations that received grants. We would use the association name as a foreign key to link it to a dataset containing data such as their yearly budget or their postal address. To locate this data on data.gouv.fr, I tried the following:
- type “associations” in the search engine
- since we are looking for tabular data, select CSV
- select “France” as the geographic scope
- explore the numerous datasets that are returned by the search
- do the same, but with the XLS format
It’s doable, but very much time-consuming. Let alone asking someone with less experience in search to find the piece of data they’re looking for. With the increasing rate and volume of data published, the current metadata will show its core limitation:
The datasets are not linked together.
We have datasets that describe the same things, but that don’t “know” about each other. There is a solution to create metadata that actually connects the dataset together: describing their content with machine-readable semantics.
Machine-readable semantics
Summary: To improve the search of datasets, the Semantic Web technologies bring a graph data model, a worldwide identification system and semantics. In this section I show how it could boost dataset crossing with a practical example.
Machine-readable: something that a machine can interpret in order to perform the relevant actions.
Semantics: meaning, the act of defining what something is.
What we need to boost our open data search is to associate meaning to the data contained in the datasets. Meaning appears when concepts are connected together with meaningful relationships. Great, the W3C has a standard to express semantics: the Resource Description Framework.
To create and use meaning, RDF works in 3 steps:
- Assign worldwide identifiers to all meaningful things: URIs (e.g. http://dbpedia.org/resource/Mexico)
- Connect the things together with properties (e.g. http://purl.org/dc/terms/creator)
- Query the resulting graph with SPARQL
For instance, the dataset about MPs could be semantically tagged with the RDF graph below:

Possible RDF graph for a dataset
A version of this graph in Turtle notation can be downloaded here.
This graph means that:
- The title of the dataset is “Réserve parlementaire 2013 de l’Assemblée nationale” in French (the @fr)
- The dataset has at least three columns: one that contains persons, one that contains departments and one that contains formal organizations (I have left the labels off the graph to save space)
- The dataset was published by something called “Minister of the Economy, Finances and Industry (France)” in English (the @en)
If the datasets stored on data.gouv.fr were all tagged semantically and I wanted to add more information about the associations listed in the MPs grant dataset, I would look for all the datasets that have a column that lists formal organizations.
The search interface would translate my search request in a SPARQL query that would look like this:

Visualization of a SPARQL query and its results
The search results would tell me that besides the dataset I already knew about, two more datasets have a column listing formal organizations, and are consequently good candidates for data enrichment.
You might think:
“So what? That can be done in SQL/NoSQL/XQuery!”
Yes, but unless you also use URIs to identify things, the scope of your identifiers will be no bigger than your database. With RDF, the scope is the World Wide Web. With a bit of tweaking, if other open data portals use the same vocabularies, I could query them all in a single shot. SQL performs well, but it lacks standardization across vendors and it’s limited to a tabular (bi-dimensional) data model.
When high-availability is required, combining an RDF/SPARQL stack for expressiveness with a NoSQL stack for performance brings the benefits of the two worlds.
Standard vocabularies already exist in RDF to describe datasets:
- The Data Catalog Vocabulary (DCAT)
- Dublin Core
- The Vocabulary of Interlinked Datasets (VoID) (relations with other datasets)
- The PROV Ontology (PROV-O) (provenance of the data: creation process, data source, involved agents, etc.)
A national dictionary
If we want to tag the columns, we need to build a reference dictionary of the things that are described in the data at the scale of the country. The purpose is similar to the creation of a controlled vocabulary.
1. Extracting the column headers
As we need to start somewhere, we might as well take care of the data that we already have. We consequently extract the column headers of all the tabular data formats that we can parse. For each column header, we add the title of dataset, the URL of the dataset, the name of the publisher, and sample data. Example for one column from this CSV (the second one published here):
- header: Parlementaire attributaire (in English: granting MP)
- dataset_title: Réserve parlementaire 2013 publiée par Bercy
- dataset_landing_page: https://www.data.gouv.fr/fr/datasets/reserve-parlementaire-* 2013-publiee-par-bercy/
- resource_url: https://raw.githubusercontent.com/regardscitoyens/Reserve-parlementaire-Bercy/master/data/1409-r%C3%A9serve-parlementaire-2013-Bercy-agr%C3%A9g%C3%A9.csv
- dataset_publisher: https://www.data.gouv.fr/fr/users/regards-citoyens/
- sample_data_1: Bernard Accoyer
- sample_data_2: Gilles Carrez
- sample_data_3: Gestion collective des sénateur SOC de la commission des finances
2. Defining what sort of data the column contains
The column above is interesting because it has a common characteristic: it lists things that are not strictly homogeneous in their nature. The sample data show two MPs and a collective fund where MPs can deposit a part of their budget.
The column consequently contains things that are part of the French Parliament and have the power to issue grants. These things can either be MPs (persons) or collective funds to which MPs contribute (organizations).
To tag the column semantically, we would link it to two types of things, “MP” and “Parliamentary collective fund”. This would result in the following RDF graph:

The RDF graph of a column.
The types (= classes) of things are in purple, the things (instances of classes) are in yellow. The column object, in the middle, contains things of two types: MP and ParliamentaryCollectiveFund . In order to link them with standard vocabularies, I have respectively declared them sub-classes of the classes foaf:Person and foaf:Organization from the FOAF vocabulary.
Via the data:hasProperty property, I have added that, in this column, each cell contains the name (foaf:name) of the MP or ParliamentaryCollectiveFund. Otherwise, looking at the RDF, we would only know what sort of thing the column describe, not what each cell contains: is that their birth date? their Web site? their role? Adding data:hasProperty and foaf:name, we know that the cells of this column contain the names of instances of MP and ParliamentaryCollectiveFund.
Now that we have created types of things, we can infer the semantics of the first cell of this column as RDF, even if it goes beyond what we are trying to achieve (we’re interested in columns, not individual records):
More important, with the right search interface, visitors could find this dataset if they are looking for datasets that mention the names of MPs or parliamentary collective funds. Or even, more generically, the names of persons or organizations.
3. Creating the dictionary
So far, we have created objects that represent the columns and linked them to their dataset and to one or more types (such as MP) and properties (such as foaf:name). However, we miss the fuel for actual semantics: the definitions of the types that we have created. Indeed, some words are polysemic, acronyms need a full form and definitions simply clear ambiguities. As an example, the definition of foaf:Organization. Fortunately, for a decent part of them, a definition will be found either:
- in a glossary maintained by the publisher of the data (ideal)
- in a dictionary (careful with copyrights)
- in an existing ontology, such as FOAF or DCAT (possible need to translate it from English)
- in Wikipedia
For the types that miss a definition (usually the most specific ones), the best approach is to ask the publisher of the data to provide it.
4. Tagging the new datasets and maintaining the dictionary
Now we have a dictionary with well-defined types and properties that are linked to datasets, we can enable a semi-automatic recognition of the columns for the newly published tabular datasets:
1. A query asks the data: among our previously tagged columns, find me all those that have a ?label (the header text) that contains “parlementaire” (the header text of the column we want to tag in the new dataset). For each matching ?column, return the ?definition(s) of the ?type(s) of things it describes and the ?propertyLabel of the ?property that it corresponds to.

A model of the corresponding SPARQL query and the results.
2. If similar columns are found, their ?definitions are suggested to the publisher, and the publisher picks the one that matches for the column in the data they are publishing (“What type of thing does the column describe?”). If none matches, either they select “I don’t know” if they don’t know what type of things the column describes, or they enter a definition that is added to the dictionary.
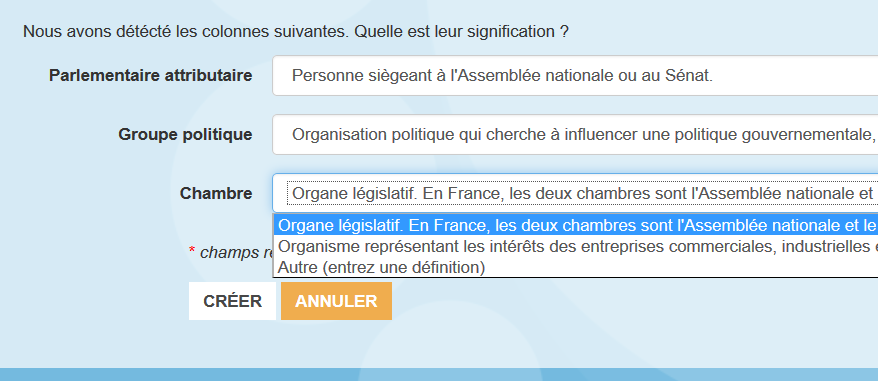
“We have detected the following columns. What is their meaning?”. The contributor either picks a definition in the list or select Other and writes a new one.
3. If the publisher found a relevant ?definition, they are also prompted to pick a ?property among those that apply to the ?type they selected via the ?definition. For instance if they select the ?definition of the ?type MP, they can pick “Name” (the ?propertyLabel of the ?property foaf:name).
4. They repeat for each column, and publish the dataset.
This procedure is a little intimidating and must be improved for an optimal user experience. But you get the idea. The publisher should be informed of the benefits of this tagging for the reuse of their dataset.
Once the dataset is published the columns that are not linked to a type are taken care of in a dedicated process.
The nirvana of data crossing
Why would we need to search for a dataset that could be crossed? Why not having a side panel on each dataset page listing the best candidate datasets for enrichment?
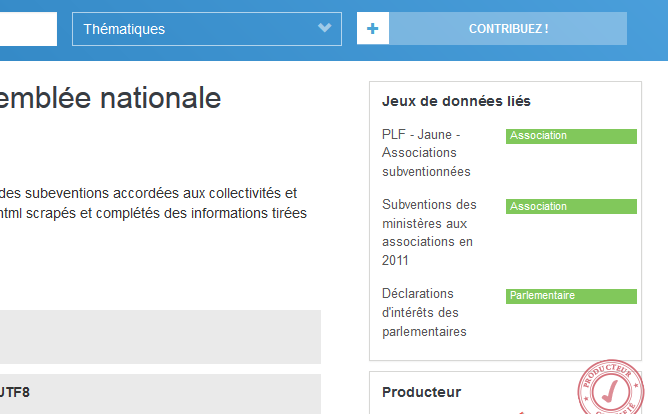
Fictitious side pane on data.gouv.fr with a list of “linked datasets”, and the name of the foreign key in green
To the infinity and beyond
In this article I only highlight the potential benefits of the Semantic Web technologies to stimulate data crossing and create more insightful datasets, thus more value! The next step is to make a prototype.
Once the dictionary is up and running, the data itself would be converted to RDF in order to enable querying across multiple sources and types of data. We could answer questions such as:
- Which ministers have never been elected and were born in a department that exported more wine than meat in 2012?
- What was the abstention rate for the last presidential elections of the cities that had an unemployment rate greater than 12 %?
- etc…
If you have any question or remark, please kickstart a conversation below or email me, I’d love to have your feedback!
Keep reading:
- Why Linked Data for data.gov.uk? by Jeni Tennison
- The Linked data book (HTML)